
Performing Reliability Test In SPSS: A comprehensive Guide
Is this your first time coming across reliability analysis in research? This article describes reliability analysis, the test used to perform reliability in SPSS, and a step-by-step process on how to run a reliability analysis test in SPSS.
What is Reliability Analysis in Research?
Reliability analysis refers to the process of assessing the consistency and stability of a measurement scale or instrument. It helps researchers determine the extent to which a tool or test produces consistent and dependable results. The analysis involves statistical techniques that evaluate the internal consistency and test-retest reliability of the measurements. The goal is to ensure that the instrument reliably measures the construct it intends to assess.
You can examine the characteristics of measurement scales and the components that make them up through reliability analysis. In other words, the reliability analysis process determines a variety of widely used scale reliability metrics and furnishes data regarding the interrelationships among the scale’s distinct items. Furthermore, inter-rater reliability estimates can be calculated using intraclass correlation coefficients.
Thus, simply stated, reliability analysis is the degree to which the items used to measure a certain attribute consistently measure what they were intended to measure. For example, let’s say you wanted to measure emotional intelligence using a set of 10 items/simple questions. The reliability of these items is a measure of how well these 10 items measure emotional intelligence.
The most widely used measure of reliability in research is the Cronbach’s alpha coefficient. Cronbach’s alpha is widely preferred over other metrics because it measures the average correlation between all values on a scale and is easier to compute and interpret.
Similar to correlation analysis, Cronbach’s alpha coefficient values lie between 0 and 1, where values closer to 1 indicate better reliability and values close to 0, indicate poor reliability. Most authors argue that items yielding a Cronbach’s alpha value above 0.70 can be said to be reliable.
Reliability Test Assumptions
Here are the assumptions that should be made when performing reliability analysis using SPSS:
- Observations should be independent
- Errors should be uncorrelated between items
- Each pair of items should have a bivariate normal distribution.
- Scales should be additive so that each item is linearly related to the total score.
How to Run Reliability Analysis Test in SPSS: Step-by-Step Tutorial
Step 1: From the SPSS menu, click Analyze, then select Scale and choose Reliability Analysis
Step 2: Select all the items measuring a specific construct (say all items measuring emotional intelligence) and move them to the box labeled items.
Step 3: Under the scale label, type the name of the construct measured by the items you inserted in the box labeled items (in this case, you could type; emotional intelligence).
step 4: Click on Statistics and make sure the following options are selected: Item, Scale, Scale if item deleted, inter-item correlation, and correlation. This is shown below;
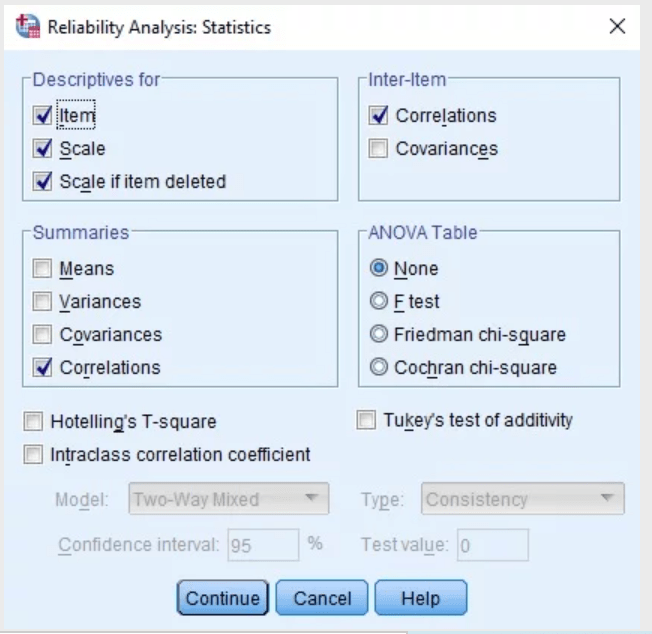
Step 5: You are done with performing reliability analysis using SPSS and you expect to see the reliability test SPSS outputs. As usual, these outputs will appear in the SPSS output window.