

How to Run Normality Test in SPSS: Statistics and Graphical Methods
This step-by-step tutorial will teach you how to do normality test in SPSS. Specifically, you’ll learn when to test hypotheses for normality assumptions, how to run the normality test in SPSS, how to interpret the normality test SPSS outputs (Shapira Wilk test and Q-Q plot), and how to report the normality test in APA Format.
What is Normal Distribution and How can we Test for Normality?
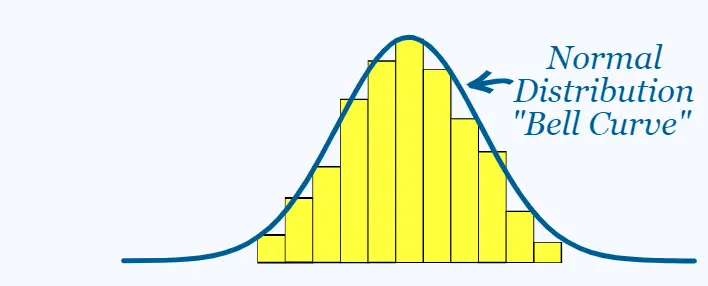
Generally, a normal distribution is a type of probability distribution, where the data values lie in a symmetrical fashion and mostly around the mean. A normal distribution is bell-shaped in nature as shown in the figure below;
Normality tests can either be performed using a statistical test or using a graphical method. One of the most widely graphical methods used for normality test is the Q-Q plot. For the statistical methods, two well-known tests are used, which are, the Kolmogorov-Smirnow and the Shapiro-Wilk test. The Shapiro-Wilk test is used to test for normality when the sample size is less than 50 (n < 50). On the other hand, the Kolmogorov-Smirnov test is widely used to test for normality when the sample size is at least 50 (n ≥50).
For both of these statistical tests, the aim is to test the null hypothesis that the data is normally distributed. This is to say, if the p-value is greater than 0.05 level of significance (p >0.05), the data can be assumed to be normally distributed.
More importantly, the normality test acts as a prerequisite test for most statistical tests such as t-tests, ANOVA, etc. Specifically, the test is important when choosing between parametric and non-parametric tests. The procedure is: using parametric tests if the data is normally distributed and non-parametric equivalent if the data is not normally distributed.
Performing Normality Test in SPSS Statistics
Consider a scenario where we’re interested in determining whether the age and height data of individuals are normally distributed. You can download the data here.
To conduct the test of normality, we need to test the hypotheses:
H0: The data are normally distributed
H1: The data are not normally distributed
The procedure for performing the normality test in SPSS is as follows;
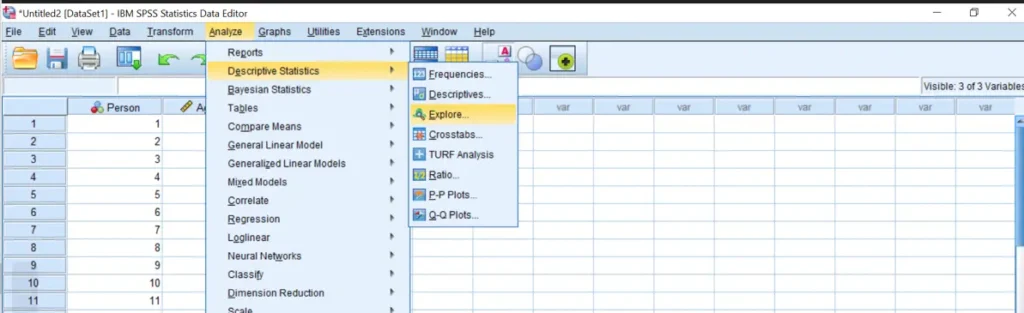
- Step 1: From the Main Menu, Click Analyze -> Descriptives -> Explore, as shown below
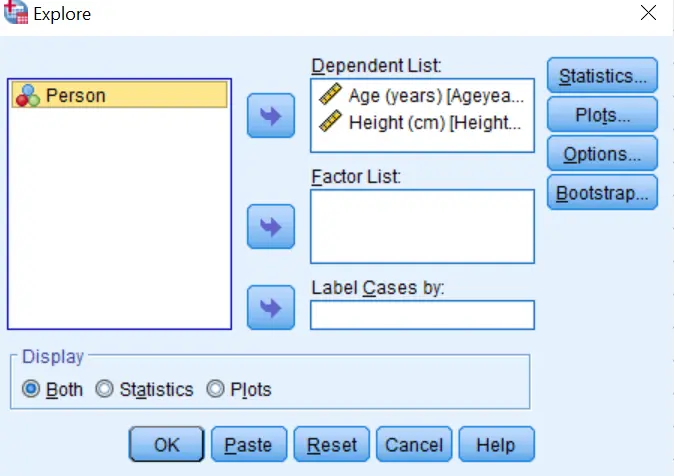
- Step 2: Transfer the variables of interest into the Dependent List box. (Based on our scenario, we transfer Age and Height to the dependent list box). You should have these outputs
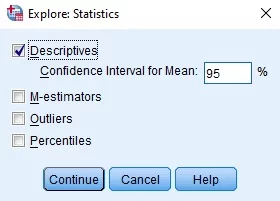
- Step 3: Click on the Statistics Button and make sure Descriptives is selected and then click Continue.
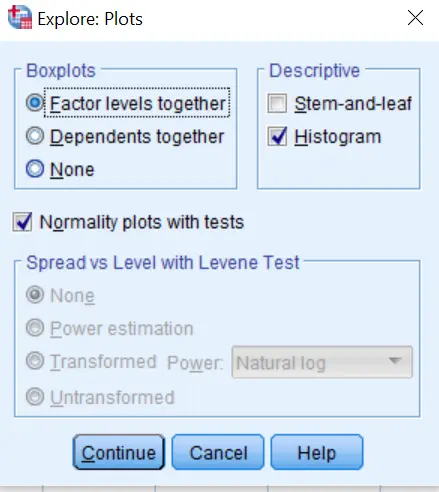
- Step 4: Click on the Plots button and make sure that Factor Levels together is selected in the Boxplots box. In the Descriptive, unselect Stem-and-Leaf and Select Histogram. Next, Select Normality Plots with tests and Click Continue.
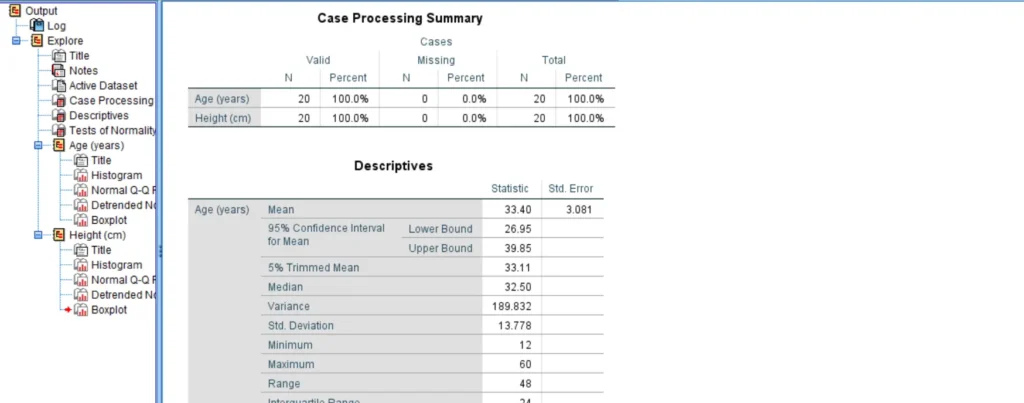
- Step 5: Click OK and the Normality Tests Results will be displayed in the SPSS Output Window as shown below;
Interpretation of Normality Test SPSS Outputs
When you run normality test in SPSS, you’re very likely to get many tables and graphs. This is because the explore command is not solely designed for testing normality but also for performing descriptive analysis of the data. So, you should not feel overwhelmed by the many outputs as we are only interested in the Test of Normality table and the Normal Q-Q plots.
Shapiro-Wilk Test of Normality(n < 50)
The tests of Normality Table below show the Kolmogorov-Smirnov results on the Left-Hand Side and Shapiro-Wilk test results on the right-Hand Side. Since our sample size was 20 observations (n < 50), we need to use the Shapiro-Wilk test results when interpreting the test of normality table. However, if your sample was at least 50 observations, then you should use the Kolmogorov-Smirnov test.
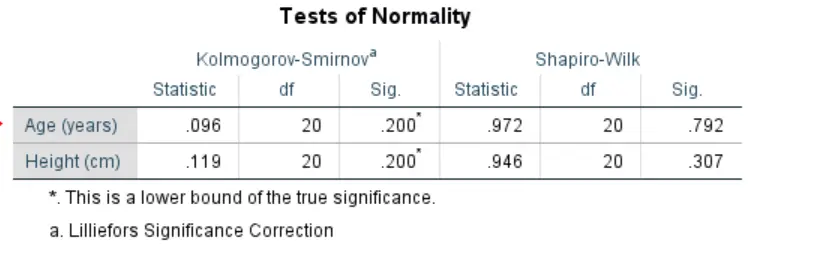
From the Table above, we can see that the p-values for age (0.792) and Height (0.307), are greater than the 0.05 level of significance. This implies that the age and height data were approximately normally distributed since the null hypothesis was not rejected.
Normal Q-Q Plot
Using the graphical method, we need to observe the normal Q-Q plot graph. The procedure for determining whether the data is normally distributed involves observing the data points and seeing whether they lie close to the diagonal line. If these points lie close to the diagonal line, then the data is assumed to be approximately normally distributed. Otherwise, the data is not normally distributed.
The figure below shows the normal q-q plot for the age variable.
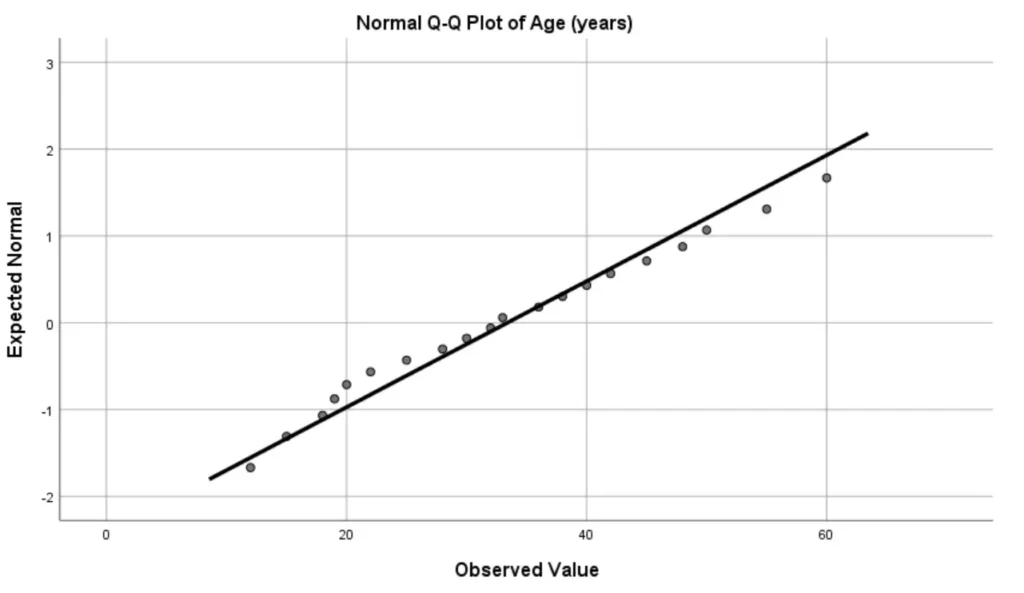
Now, based on the above normal q-q plot, we can see that most of the points lie very close to the diagonal line. Thus, we can conclude that the age data was normally distributed.
How to Report Normality Test Results In APA Style
This is how you should report the normality test results in APA.
The shapiro-wilk test was used to determine whether the Age and Height data wre normally distributed. The p-value for the Age data (0.792) was greater than 0.05, suggesting that we should fail to reject the null hypothesis and conclude that the data was normally distributed. Similarly, the p-value for the Height data (0.307) was also greater than 0.05, suggesting that we should fail to reject the null hypothesis and conclude that the height data was normally distributed.