
Performing a Multiple Linear Regression Using SPSS
This SPSS tutorial provides a step-by-step procedure for performing multiple linear regression analysis in SPSS. Specifically, the article presents a comprehensive overview of a multiple linear regression, assumptions, and a step-by-step guide on how to run a multiple linear regression in SPSS.
Definition: What is a Multiple Linear Regression?
Multiple linear regression (MLR), often called multiple regression, is a statistical method that harnesses the power of multiple factors to predict the outcome of a particular variable. The main aim of multiple linear regression analysis is to create a model that explains how the different factors are related to the variable of interest. In other words, multiple linear regression analysis helps in determining which factors (independent variables) significantly influence the variable of interest (dependent variable). In fact, multiple regression analysis is an extension of the simple linear regression, but when we have more than one predictor.
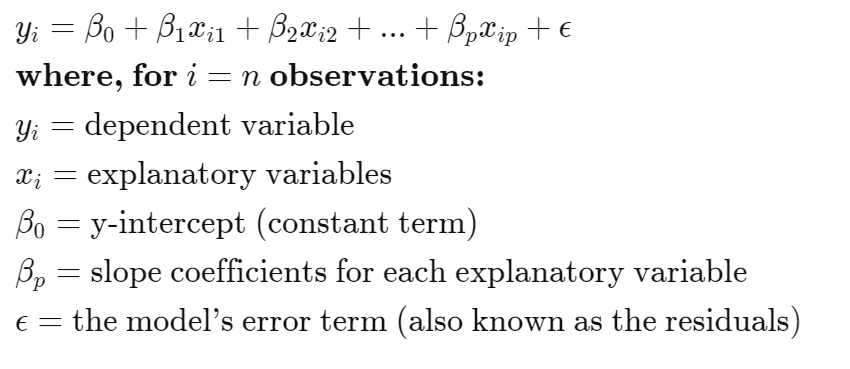
Based on the above definition, it is clear that a multiple linear regression model is suitable whenever we want to investigate the effects of various factors/predictors on the dependent variable. The general equation of multiple linear regression is given by;
Multiple Linear Regression Analysis Assumptions
Before performing a multiple linear regression in SPSS, you need to ensure various assumptions are met. The main assumptions for a multiple linear regression include:
- The dependent variable should be measured on a continuous scale (it can either be a ratio or interval variable)
- There should be at least two independent variables (these can either be continuous or categorical)
- The observations should be independent – This can be checked using the Durbin-Watson statistics.
- There should be a linear relationship between the dependent variable and each of the independent variables, as well as, a linear relationship between the dependent variable and independent variables, collectively. The linearity assumption can be checked using scatter plots and partial regression plots.
- Homoscedasticity assumption – This assumption requires that the variances be constant. This assumption is assessed by plotting the studentized residuals vs. the unstandardized predicted values.
- There should be no multicollinearity – This means that the independent variables should not be highly correlated with each other. This assumption is texted using the Tolerance/Variance Inflation Factor.
- There should be no significant outliers – The outliers and high influential points can be checked using Cook’s distance.
- The residuals (errors) should be approximately normally distributed – This assumption is checked using either a Normal P-P plot, Normal Q-Q plot, or statistics such as the Shapiro-Wilk test. You can check out our detailed tutorial on how to perform normality tests in SPSS.
How to Run Multiple Linear Regression Analysis in SPSS
Once you have checked the assumptions and confirmed none of them is violated. It’s time to run the multiple linear regression analysis in SPSS. The procedure for performing a multiple linear regression analysis in SPSS is simple and straightforward. You only need to follow the following 7 major steps and you’re done.
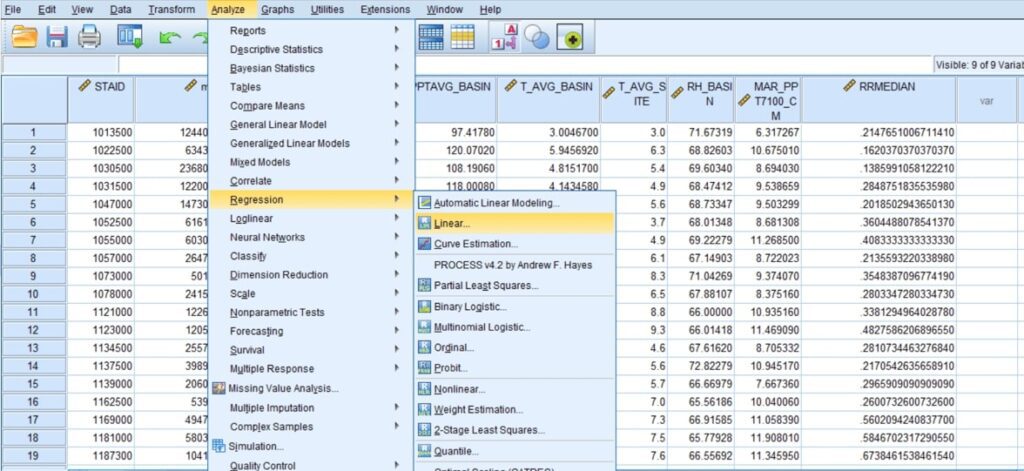
- Step 1: On the Main Menu, Click Analyze > Regression > Linear as shown below.
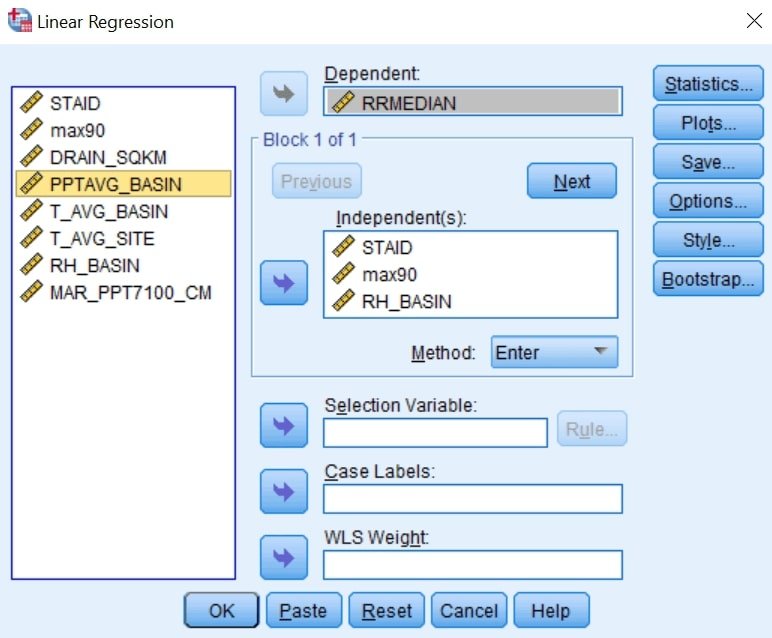
- Step 2. On clicking Linear, You will be presented with the Linear Regression dialogue box below:
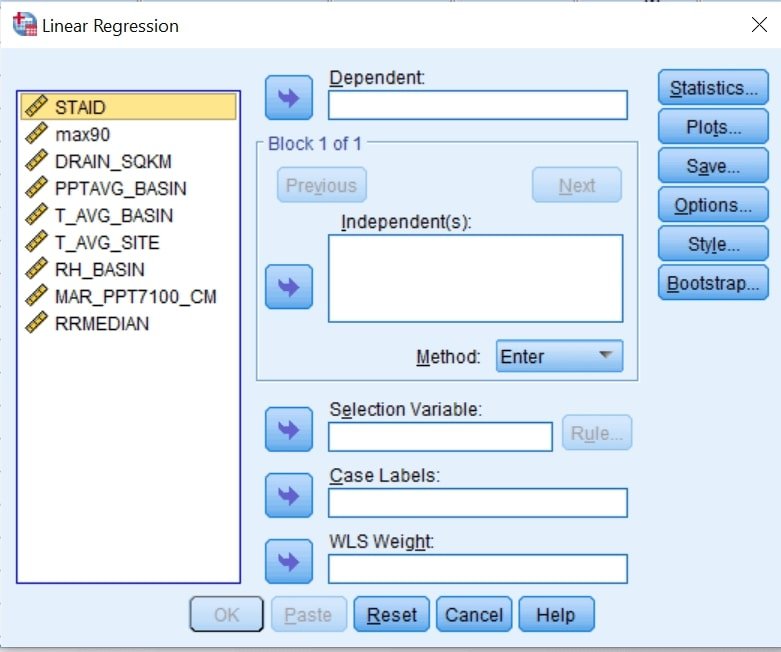
- Step 3. Transfer the dependent variable into the Dependent: box and the independent variables, into the Independent(s): box as shown below;
You can ignore the other boxes. You should obtain an output similar to this.
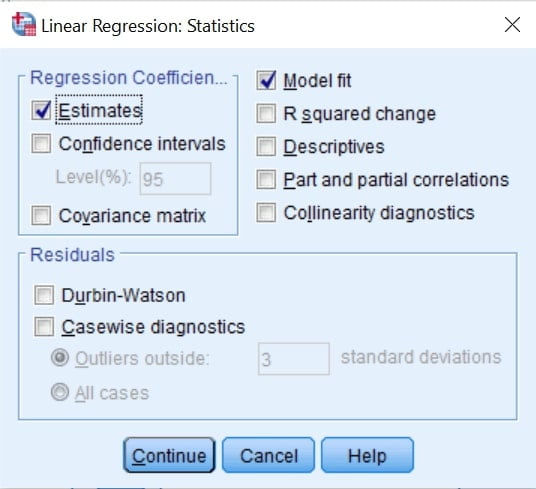
- Step 4. Click on the Statistics button. You will be presented with the Linear Regression: Statistics dialogue box, as shown below:
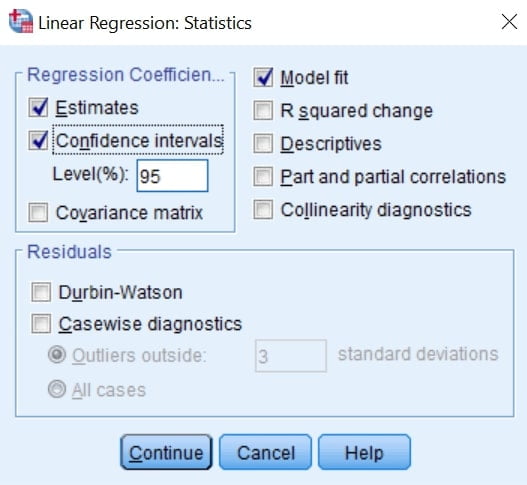
- Step 5. Without changing the options selected by default, Select Confidence intervals in the –Regression Coefficients– area (You can leave the confidence level to 95% or change to the desired level). You should have the following screen.
- Step 6. Click on the Continue button. You will be returned to the Linear Regression dialogue box.
- Step 7. Click ok and the Multiple Linear Regression Outputs will be generated.
Struggling with the interpretation of regressional analysis outputs. Check out our detailed guide on how to interpret multiple linear regressional analysis SPSS outputs.