
How to Run a one-way ANOVA in SPSS: A Comprehensive Guide for Beginners
In this comprehensive tutorial, we will explore how you can perform a one-way anova in spss. You will gain an in-depth understanding of one-way anova assumptions, as well as, understanding how to run a one-way anova in SPSS step by step.
What is a One-way ANOVA Test ?
One-way ANOVA also called one-way analysis of variance (ANOVA) test is an inferential statistics test widely used in research. In particular, it is a statistical test used to determine whether there exists any statistically significant differences between two or more independent groups (factors). In other words, a one-way anova test allows you to examine the impact of a categorical variable with three or more groups, referred to as the factor, on a continuous dependent variable. It serves as an extension of the t-test, which is used for comparing means between two independent samples, but ANOVA facilitates the comparison among more than two groups.
One-Way Anova Test Assumptions
Before delving into the practical implementation and interpretation of the One Way ANOVA test, it is important to acknowledge the underlying assumptions associated with this statistical procedure. The most common assumptions for one-way anova are:
- Continuous dependent variable: The dependent variable should be measured in a continuous scale
- Multiple independent groups: The factor being studied should consist of two or more independent groups.
- Independence of observations: Each observation within the study should be independent of the others.
- Absence of outliers: Outliers, which are extreme values that deviate significantly from the rest of the data, should not be present.
- Normal distribution: The dependent variable should follow a normal distribution. It is worth noting that one-way ANOVA is a parametric technique, relying on the assumption of normality. Check out our detailed article on how to run normality test in SPSS.
- Homogeneity of variance: The variance of the dependent variable should be similar across all groups.
One-Way ANOVA test Example Scenario
To better illustrate the implementation of the ANOVA test, let’s consider an example scenario where we want to assess the effect of four different fertilizers on the growth of plants (measured using plant heights). In this case, the four different types fertilizers, say Fertilizer A, B, C and D are the categorical/independent variable (factor). The height of the plants represents the continuous dependent/response variable.
Now, let’s outline the null and alternative hypotheses for our ANOVA test:
Null hypothesis:
There is no significant difference in plant height between the four groups of fertilizers applied to the plants
Alternative hypothesis:
At least any two types of fertilizers yielded significantly different heights
Multiple Comparison Tests in One-Way ANOVA
A one-way ANOVA only informs you whether there exists significant difference between the groups. This means, anova test will not explicitly highlight the groups that differs from each other. To achieve this, post-hoc analysis is performed. There are several tests used in post hoc analysis. Some of these tests include:
- Tukey’s Honestly Significant Difference (HSD): This test is widely used to compare all possible pairs of group means. It helps in controlling the Type 1 error, thus, helping in determining the specific groups that are statistically significant.
- Bonferroni correction: This test adjusts the significance level for multiple comparisons by dividing the given level of significance (alpha) by the number of comparison. This helps in maintaining the overall level of significance.
- Scheffe’s method: Scheffe’s test is a conservative post hoc test that compares all possible group combinations. It provides simultaneous confidence intervals for all possible pairwise comparisons. Thus, it allow the researcher to identify the significant differences between groups while controlling the family-wise error rate.
- Fisher’s Least Significant Difference (LSD): This test compares all possible pairs of group means and determines the significance of the observed differences. It does not control for the family-wise error rate, so caution should be exercised when interpreting the results.
- Dunn’s test: Dunn’s test is a non parametric post hoc test used when the assumptions of ANOVA are violated. It compares group means using rank-based procedures. It is often used in situations, where the data distribution is not normal or when there are unequal variances.
- Games-Howell test: The Games-Howell test is also a non parametric test that does not assume equal variances or normality. It compares all possible pairs of group means and provides adjusted p-values to account for multiple comparisons.
These post hoc tests help researchers determine which specific group differences are statistically significant after an ANOVA analysis. This means, if the ANOVA results are insignificant, there is no need for conducting a post hoc analysis tests. The choice of which post hoc test to use will generally depend on your study design, the assumptions of the data distribution and the specific research questions proposed by the researcher.
Looking to gain a deeper understanding of parametric and non parametric tests? check out this informative guide: difference between parametric and non-parametric tests made easy. You can also hire an expert statistician to help you with statistics homework. Just click the button below.
[order_button_dark]
How to Run One-Way ANOVA in SPSS: Step-by-Step Procedure
Looking for a step by step tutorial on how to run a one-way anova in SPSS? Here you will gain a comprehensive understanding on how you can perform a one-way anova test, followed by a post hoc test. You will also learn how to interpret ANOVA results in APA format.
One-Way ANOVA in SPSS Example
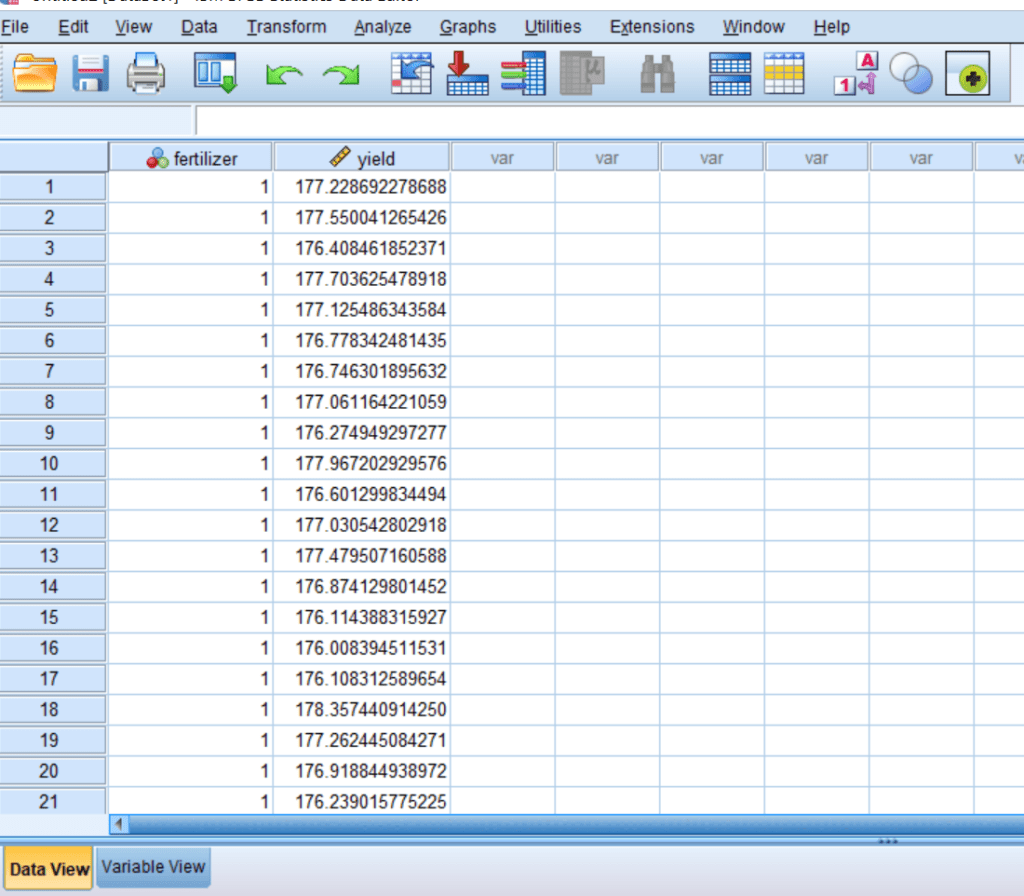
suppose we want to determine whether there is a difference in the mean yield of plants between three types of fertilizers. Here, the dependent variable is yield, whereas the independent variable is types of fertilizers with levels 1, 2, and 3. The data was imported into spss as shown below.
1. Import Data into SPSS
Generally, the data comes in different format. Regardless of how the data is, SPSS provides you with a way to import different data format into spss. Once, you’ve imported the data into spss, it should appear as shown below:
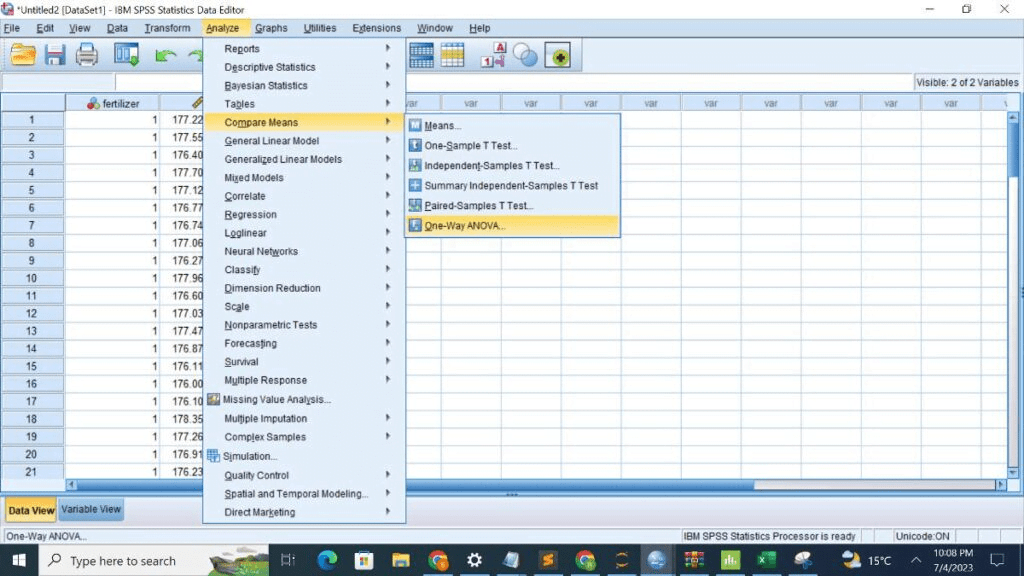
2. From the SPSS menu Select Analyze > Compare Means > One-way ANOVA
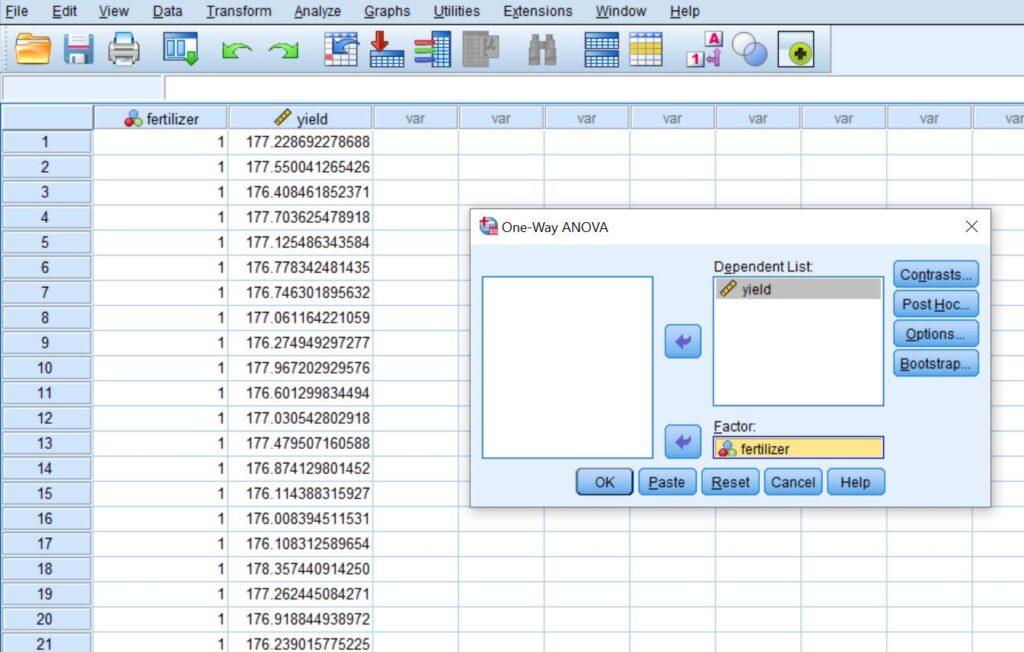
3. Add your dependent variable (should be continuous) to the Dependent List box, and add the independent variable (should be categorical) to the Factor box.
Once you click on one-way anova button, a box with variables will open. Transfer the continuous variable wage into the dependent list box, and factor variable responsibility to factor box.
4. Click Options. Check the box for Descriptive, Homogeneity of Variance and Means plot, then click Continue.
Choose Options, and a new window will appear. Check Descriptive, Homogeneity of variance test and Means plot Click Continue.

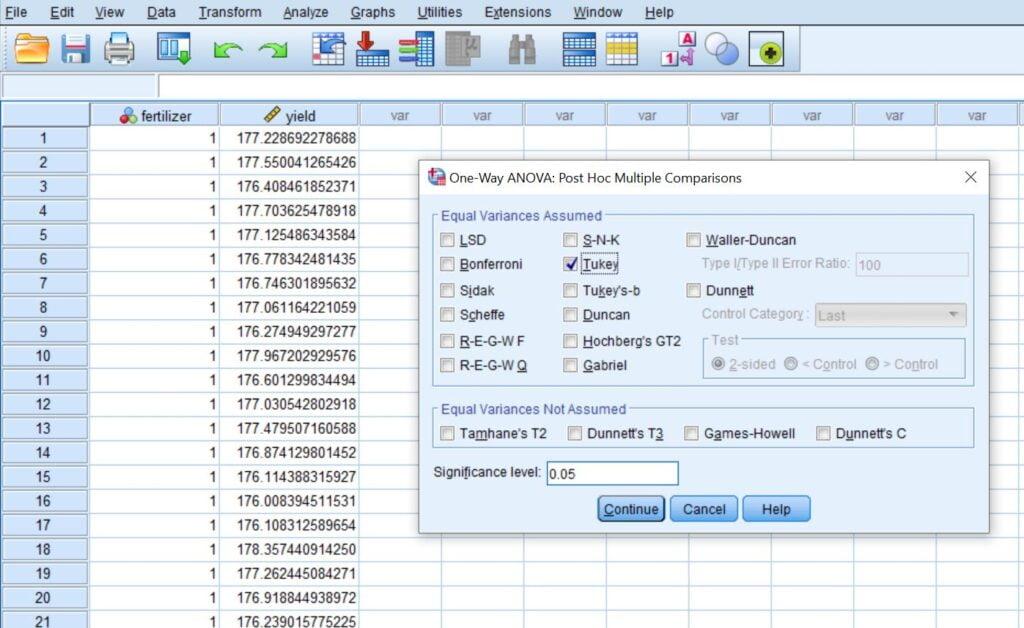
5. Click Post Hoc and on the Equal Variances Assumed, click Tukey, then click Continue.
If we assume that we have equal variance across the group so we will use the first box of tests. The Tukey HSD test is the best option for this assumption. On the other hand, if our data does not have equal variance then we can pick up the Games-Howell or the LSD test.
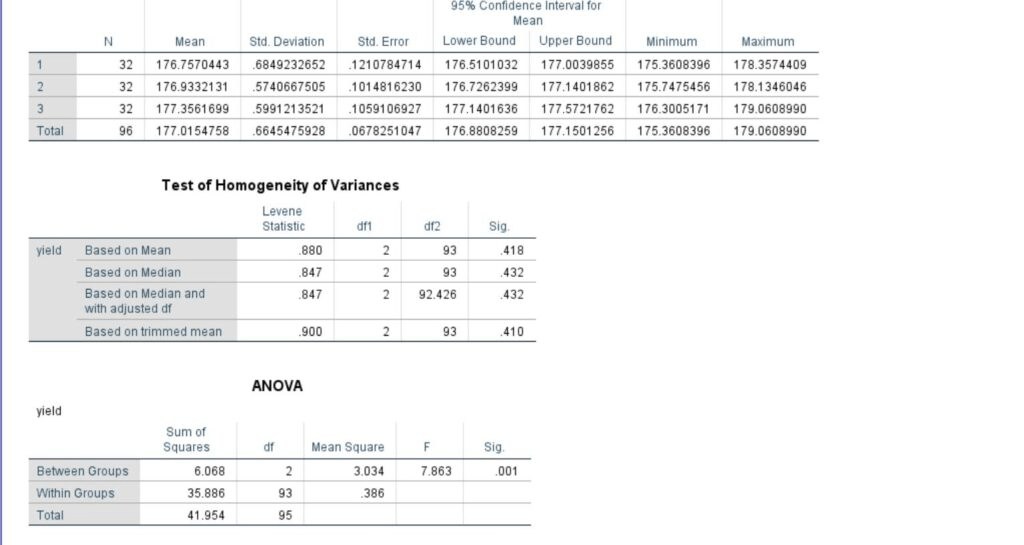
6. One-Way ANOVA SPSS Output
The results will appear in the output window.
Summary of Running Procedure for One-Way ANOVA in SPSS
To run a One-Way ANOVA in SPSS,
- Click Analyze > Compare Means > One-Way ANOVA.
- Add your dependent variable (should be continuous) to the Dependent List box, and add the independent variable (should be categorical) to the Factor box.
- Click Options. Check the box for Descriptive, Homogeneity of Variance and Means plot, then click Continue.
- Click Post Hoc and on the Equal Variances Assumed, click Tukey, then click Continue.
- Click Ok.
Boom! You have successfully performed a one-way ANOVA in SPSS and you’ve SPSS Output
To Learn how to interpret these SPSS Outputs, Check out our step by step guide on reporting one-way anova spss output.
Also, if you’re still struggling with your spss homework or data analysis for your dissertation, worry no more! Online-spss is the best place for reliable spss homework help and spss data analysis services for your dissertation, thesis paper, capstone project or any other business project.
Citation
https://online-spss.com. (2023, June 27). How to Run a one-way anova in spss – Online spss help. https://online-spss.com/how-to-run-a-one-way-anova-in-spss/