
Have you conducted an independent samples t-test in SPSS to compare the means between two independent groups? If you’re struggling with the interpretation of the results, then you’re in the right place. In this article, you’ll learn how to interpret independent sample T-Test SPSS Outputs and how to report the independent t-test SPSS Outputs in APA style. However, before you dive into the interpretation, ensure you’ve followed the proper steps for running an independent t-test in SPSS. If you need a refresher, check out our comprehensive tutorial on how to perform an independent sample T-test using SPSS.
How to Interpret the Independent T-Test SPSS Outputs
Independent Sample T-Test SPSS Outputs
Based on our detailed guide on how to run an independent sample t-test using SPSS, the following SPSS outputs were obtained:
Interpretation of Independent Sample T-Test SPSS Outputs
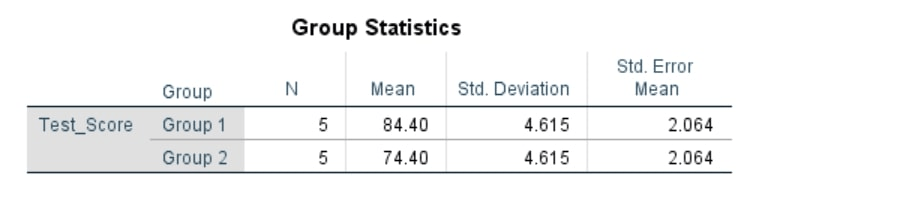
Group Statistics
- Group 1:
- Number of participants (N) = 5
- Mean test score = 84.40
- Standard deviation = 4.615
- Standard error of the mean = 2.064
- Group 2:
- Number of participants (N) = 5
- Mean test score = 74.40
- Standard deviation = 4.615
- Standard error of the mean = 2.064
The mean test score for Group 1 is higher than that for Group 2, with both groups having the same standard deviation and standard error.
Independent Sample T-Test Results
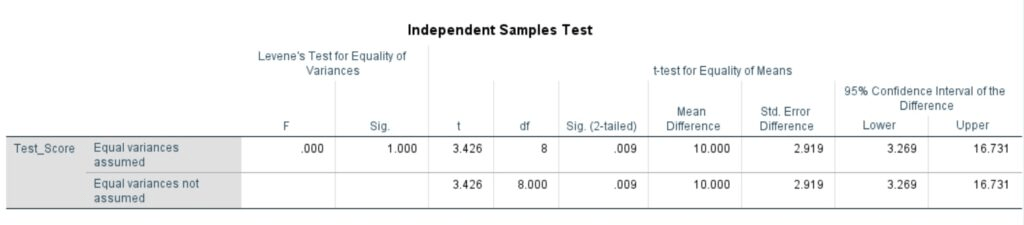
Equality of Variance
- The Levene’s Test checks if the variances of the two groups are equal.
- F = 0.000 and Sig. (p-value) = 1.000.
- Since the p-value (1.000) is much greater than 0.05, we fail to reject the null hypothesis that the variances are equal. Therefore, we can assume equal variances for the t-test.
t-test for Equality of Means
This part provides the results of the t-test under the assumption of equal variances (top row) and not assuming equal variances (bottom row):
Based on the fact that the assumption of equality of variances was met, we need to use the T-Test Results from the top row.
Thus, the independent sample t-test SPSS outputs can be interpreted as follows:
t-value: The t-statistic is 3.426. Degrees of Freedom (df): The degree of freedom is 8. Sig. (2-tailed): The p-value is 0.009.
- Since the p-value (0.009) is less than 0.05, we reject the null hypothesis. This indicates that there is a statistically significant difference in the mean test scores between Group 1 and Group 2.
Mean Difference: The mean difference between the two groups is 10.000. This means that, on average, Group 1 scored 10 points higher than Group 2.
Std. Error Difference: The standard error of the difference between the two means is 2.919.95%
Confidence Interval: The confidence interval for the mean difference ranges from 3.269 to 16.731. This interval does not include zero, further indicating that the difference in means is statistically significant.
How to Report Independent Samples T-Test SPSS Outputs in APA Style
If you’re writing your dissertation data analysis chapter and looking for a guide on how to report independent T-test SPSS Outputs in APA format, this guide is for you.
An independent samples t-test was conducted to compare the test scores of students who participated in an after-school tutoring program (Group 1) and those who did not (Group 2). Levene’s test was conducted to assess the equality of variances for the two groups. The results of Levene’s test, F(1, 8) = 0.000, p = 1.000, indicated that the assumption of homogeneity of variances was met. The independent samples t-test revealed a significant difference in test scores between students who participated in the after-school tutoring program (M = 84.40, SD = 4.62) and those who did not (M = 74.40, SD = 4.62); t(8) = 3.43, p = .009. The mean difference in test scores was 10.00 points, with a 95% confidence interval ranging from 3.27 to 16.73. This result indicates that participation in the tutoring program was associated with significantly higher test scores. The results further suggest that the tutoring program had a positive impact on student performance.