
How to Run a One-Sample T-Test Using SPSS
In this step-by-step tutorial, you’ll gain a comprehensive understanding of a one-sample t-test when to use it, and how to run a one-sample t-test in SPSS. In other words, the main aim of this tutorial is to help students gain a comprehensive understanding of how to run a one-sample t-test in SPSS.
What is a One-sample t-test?
A one-sample t-test is a type of inferential statistic that is used to compare a sample mean to a hypothesized population mean. It is useful when you want to determine whether the sample mean is significantly different from the hypothesized population mean.
Assumptions
Once you’ve settled on a one-sample t-test, it is important to ensure your data is suitable for performing a one-sample t-test. This is mainly done by testing 4 major assumptions. These 4 main assumptions for a one-sample t-test include:
- Assumption #1 – The dependent variable should be measured at the interval or ratio level. That is, it should be continuous. A good example of a continuous variable is the scores of students on a test measured out of 100.
- Assumption #2 – The observations should be independent. In other words, there should be no relationship between the observations. This assumption is generally assumed if the data was randomly selected from the sample.
- Assumption #3 – There should be no significant outliers in the data. Generally, outliers are data points that fall far away from the other data points in the data. Suppose that you’ve got a data set containing students’ scores ranging between 0 and 100 and you find a data point with 150. This would be an outlier. Outliers can be detected by creating a box plot of the dependent variable using SPSS.
- Assumption #4 – The dependent variable should be approximately normally distributed. This is tested using the Shapiro-Wilk test in SPSS. You can learn how to perform this test using our comprehensive article on how to run normality tests in SPSS.
One-Sample T-Test Example
A high school biology teacher introduces a new study method designed to improve students’ test scores. The school has historically known that the average test score in biology is 75 out of 100 based on years of data. The teacher wants to determine if this new study method is effective in increasing students’ scores beyond the historical average. So, the teacher randomly selects a sample of 30 students to apply this new study method over a semester. At the end of the semester, a standardized biology test is administered to these 30 students.
Here, the appropriate statistical test is a one-sample t-test since we want to compare the average test scores with the hypothesized mean of 75.
We will be testing the hypothesis;
H0: μ = 75
Versus
H1: μ > 75
For this statistical test, we should have only one variable (test_score) entered into the SPSS. You can download the data below;
How to Run a One-Sample T-Test in SPSS: Step-by-Step
The procedure for running a one-sample t-test using SPSS is straightforward. Just follow these 4 steps and you’ll be done.
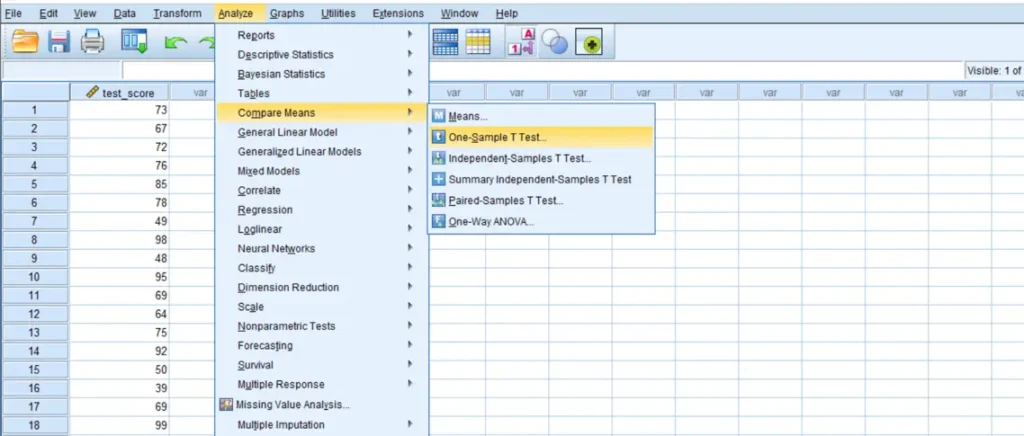
Step 1: Click Analyze -> Compare Means -> One-Sample T-Test
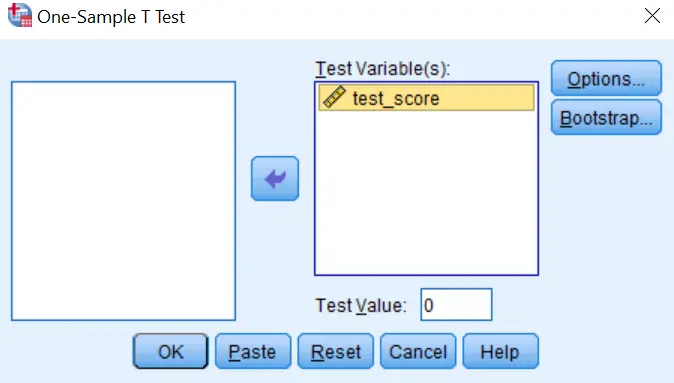
Step 2: Drag and drop the variable you want to test against the population mean (in this case, test_score) into the Test Variable(s) box
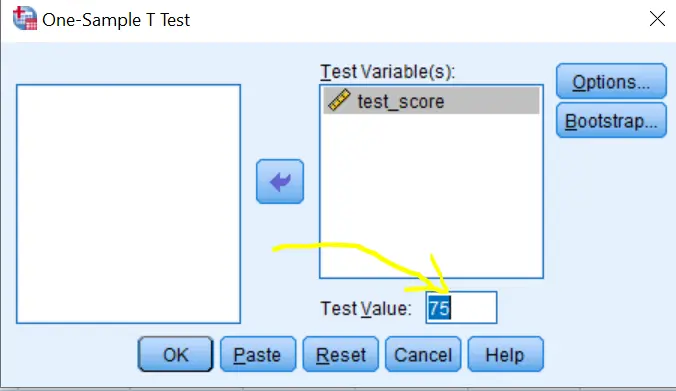
Step 3: Specify your population mean in the Test Value box
In this case, we specify the population mean as 75, as defined in the example
Step 4: Click OK.
Your result will appear in the SPSS output viewer as shown below
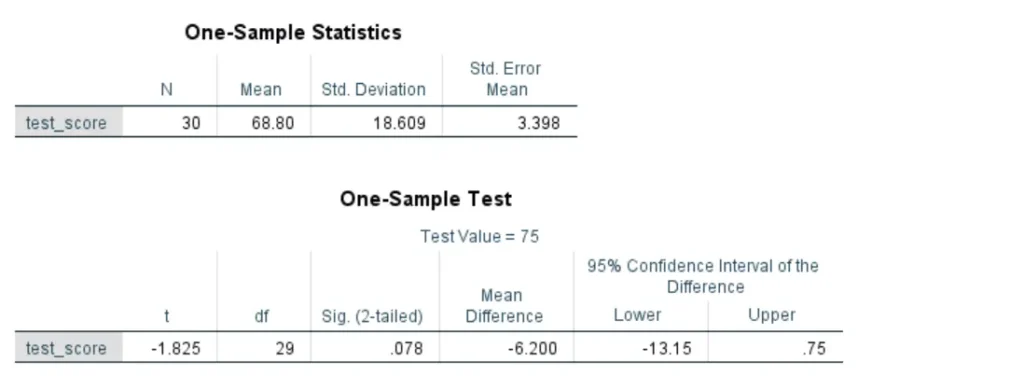
Struggling with how to interpret one-sample T-test SPSS outputs? Check out our detailed guide on how to report one-sample t-test SPSS outputs