

In hypothesis testing, a critical value is a threshold or cutoff point that defines the boundary of the rejection region…
In this the previous tutorial, we learned how to perform a one-way ANOVA in SPSS. Here, we will learn how to interpret and report one-way ANOVA outputs. By the end of this tutorial, you will learn:
- How to get insights from descriptive table
- How to interpret homogeneity of variance table
- How to interpret one-way ANOVA table
- How to interpret Pairwise comparison test
- Reporting one-way ANOVA SPSS output in APA format.
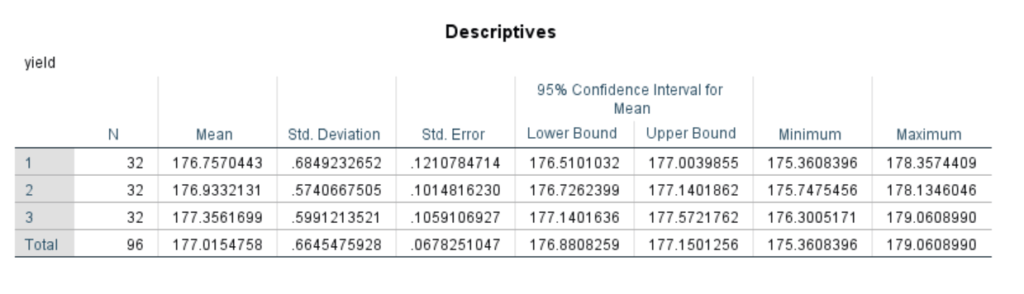
Descriptive statistics
Taking a quick look at the descriptive statistics generated from the one-way anova spss outputs, our sample data reveals a disparity yield among the three types of fertilizers used. Notably, the descriptive statistics shows that the average yield for Fertilizer 3 was slightly higher than that of Fertilizer 2 and Fertilizer 3.
Although this difference might seem negligible, we still do not have sufficient evidence to say whether these mean differences are statistically significant. Why? we need to perform an inferential statistics (in this case, a one-way ANOVA) to determine whether there was significant mean yield difference between any two types of fertilizers. Simply stated, we want to determine whether there is a significant difference in the average yield between:
- Fertilizer 1 and 2
- Fertilizer 1 and 3
- Fertilizer 2 and 3
Homogeneity of Variance in One-Way Anova
This is a major assumption when it comes to performing a one-way anova test. The assumptions requires that the variance of each independent group (Fertilizer types) to be equal. Specifically, we aim to test the hypotheses:
H0: The variances are equal
H1: The variances are not equal
SPSS output
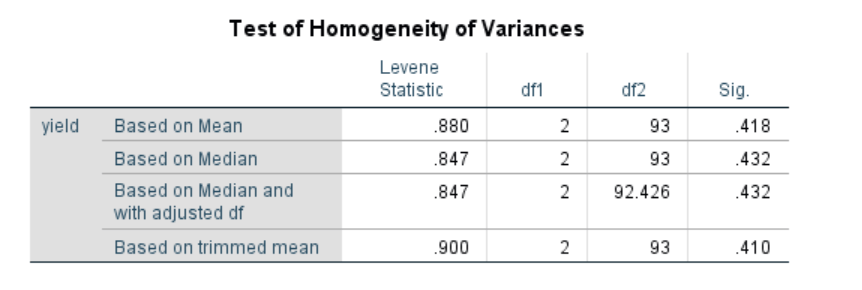
Based on the above SPSS output, and assuming that the data were normally distributed, we can interpret the homogeneity of variance based on mean. From the table, the test statistics is the Levene’s statistic, F =0.880. The p-value is 0.418
Decision and conclusion
Let’s assume the level of significance, α = 0.05.
Since the p-value (0.418) is greater than the 0.05 significance level, we fail to reject the null hypothesis. This means that there is sufficient evidence to assume that the three groups had equal variance. In other words, the homogeneity of variance assumption has been met.
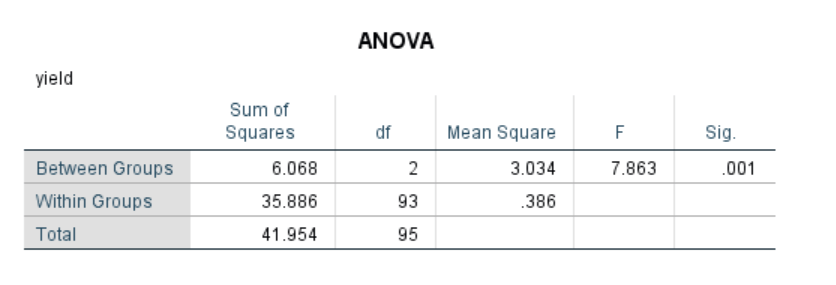
One-Way ANOVA SPSS Output Interpretation
The analysis of the data yielded the following ANOVA table. The ANOVA table helps in determining whether there is a significant difference between the groups. In this case, the ANOVA table will inform us whether there was a significant difference in the average yield among the three types of fertilizers. Specifically, we need to test the hypotheses:
H0: On average, the three Fertilizers produced similar yields (there was no significant difference in mean yield between the three fertilizers)
H1: At least two Fertilizers were significantly different.
Test statistic
From the output, the test statistic is F = 7.863
P-value = 0.001
Decision
Let’s assume the level of significance, α = 0.05.
Since the p-value (0.001) is less than the significance level,α, we reject the null hypothesis
Conclusion
There is sufficient evidence to conclude that there was a significant mean different among the three types of Fertilizers. In other words, at least two Fertilizers produced significantly different yields.
With significant results, we need to perform multiple comparison test (in our case, we used the Tukey HSD test).
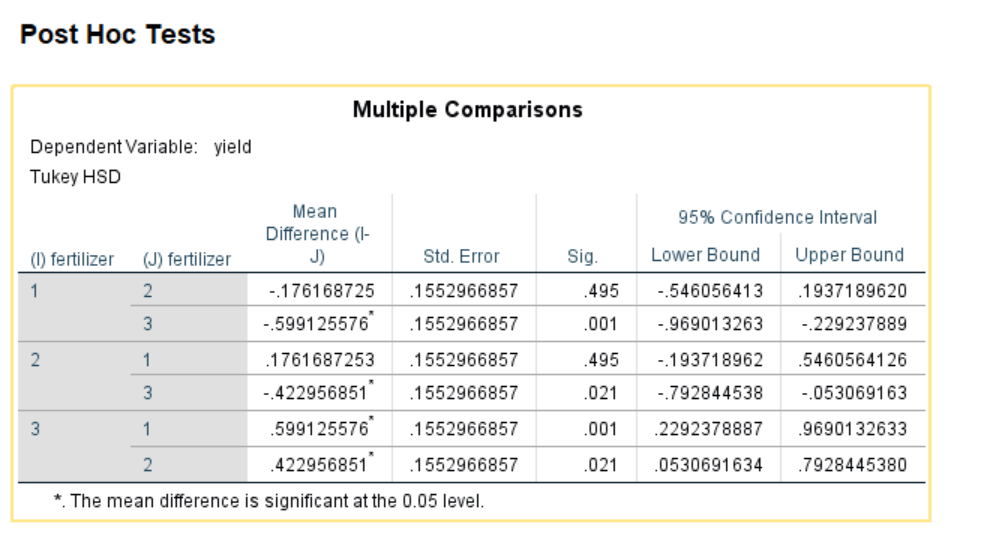
Multiple Comparison Using Tukey HSD ANOVA Interpretation
Multiple comparison test using Tukey HSD was performed to determine which Fertilizers produced more yields than the other. The results are as shown in the SPSS output below.
To understand these results, please take note of the asterisk (*). Whenever you see the asterisk, it means that the two groups are significantly different.
Also take note of the -ve and +ve signs and values. Same values are repeated but with different signs. So you don’t need to repeat the interpretation of those groups.
Based on the above outlined criteria, we can see that the following groups (types of fertilizers) produced significantly different yields.
- Fertilizer 1 and 3
- Fertilizer 2 and 3
However, there was no significant mean difference in yield between Fertilizer 1 and 2
To be specific:
- Fertilizer 3 produced significantly more yields than Fertilizer 1
- Fertilizer 3 produced significantly more yields than Fertilizer 2
Reporting One-way ANOVA SPSS output in APA
A one-way ANOVA was conducted to determine the effect of three different types of fertilizers (1, 2, 3) on crop yields. The results showed a significant effect, F(2, 93) = 7.86, p = .001. Post Hoc tests were conducted using Tukey’s HSD test. The comparison revealed significant difference between Fertilizer 3 (M=177.36, SD= 0.60) and Fertilizer 1 (M= 176.76, SD=0.68); between Fertilizer 3 (M=177.36, SD= 0.60) and Fertilizer 2 (M= 176.93, SD=0.57). We, therefore, reject the null hypothesis that different types of fertilizers ( Fertilizer 1, 2 and 3) have the same effect on crop yields. Thus, there was sufficient evidence to cibclude that Fertilizer 3 produced significantly more yields than Fertilizer 1 and Fertilizer 2. However, there was no significant difference in the average crop yields between Fertilizer 1 and Fertilizer 2.
Citation:
https://online-spss.com. (2023, June 27). Reporting one-way anova spss outputs – step by step. https://online-spss.com/reporting-one-way-anova-spss-output/
Still struggling with your spss homework? You can now pay someone to do your SPSS homework for you at online-spss.com. The ordering process is simple. Just click the Order Now button below to get started.
[order_button_dark]