

In hypothesis testing, a critical value is a threshold or cutoff point that defines the boundary of the rejection region…
The Chi-Square Goodness of Fit test is a statistical method used to determine whether observed data follows an expected distribution. It helps researchers assess if differences between observed and expected values occur due to chance or indicate a significant pattern. This test is widely used in research, business, and social sciences. For example, businesses use it to check if customer preferences match projected sales, while researchers apply it to test genetic inheritance patterns. In this article, we will explain the test’s purpose, assumptions, and formula. Additionally, we will provide a step-by-step guide on how to perform the test with a practical example and discuss how to interpret the results accurately.
What is the Chi-Square Goodness of Fit Test?
The Chi-Square Goodness of Fit test is a statistical method used to check whether observed data matches an expected distribution. It helps determine whether the differences between what we observe and what we expect happen by chance or indicate a significant pattern. This test is used when working with categorical data, where values fall into distinct groups. It is useful for comparing observed frequencies to expected frequencies.
For example, suppose a company predicts that 30% of customers prefer Product A, 40% prefer Product B, and 30% prefer Product C. After surveying customers, the actual preferences may differ. The Chi-Square test helps determine if this difference is significant.
Another example is rolling a fair six-sided die. We expect each number to appear about 1/6 of the time, but actual results may vary. The test checks whether this variation is due to randomness or an unfair die.
Assumptions
Imagine you are testing whether a six-sided die is fair. Before using the Chi-Square Goodness of Fit test, you must ensure your data meets certain assumptions. If these assumptions are not met, the test results may be inaccurate.
Here are the key assumptions:
- The data must have only one categorical variable – The test is designed for a single categorical variable with multiple categories (e.g., types of fruit people buy or preferred movie genres).
- The data must be categorical – Each observation should fall into distinct groups, such as “Yes/No” responses or product choices.
- The expected frequency for each category should be at least 5 – Each category must have enough observations to ensure reliable statistical results. If some categories have fewer than five, consider combining them or using a different test.
- The observations should be independent – Each data point should be collected without influence from others. For example, survey responses from individuals must be independent of one another.
Chi-Square Goodness of Fit Test Formula
The Chi-Square Goodness of Fit test measures how well observed data matches expected data using the following formula:
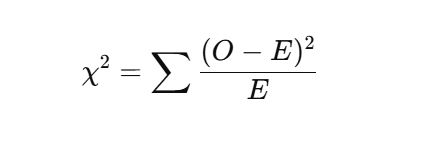
Where:
- χ2 is the chi-square goodness of fit value (Test Statistic)
- O is the observed frequency, which represents the actual count of occurrences in each category.
- E is the expected frequency – The theoretical count we would expect if the data follows a specified distribution.
- ∑ is the summation symbol, which indicates that we calculate the value for each category and sum them up.
The formula calculates the squared differences between observed and expected values, then divides by the expected value. This helps measure how much the observed data deviates from what is expected. A larger chi-square value suggests a bigger difference, which may indicate that the observed data does not fit the expected distribution well.
How to Perform the Chi-Square Goodness of Fit Test By Hand
Let’s go through each step with a worked example. Suppose a candy company claims that the distribution of colors in their chocolate packs is:
- Red: 30%, Blue: 20%, Green: 25%, Yellow: 25%
You buy a pack of 100 chocolates and count the colors. Your observed data is:
- Red: 25, Blue: 18, Green: 30, Yellow: 27
Now, let’s perform the Chi-Square Goodness of Fit test to determine if the observed data significantly differs from the expected distribution.
Step 1. Define the Hypotheses
- Null hypothesis (H0): The observed color distribution matches the expected distribution.
- Alternative hypothesis (Ha): The observed distribution differs from the expected distribution.
Step 2. Collect and Summarize the Observed Data
Based on the given example, the observed values (O) are:
| Candy Color | Observed Frequency (O) |
|---|---|
| Red | 25 |
| Blue | 18 |
| Green | 30 |
| Yellow | 27 |
Step 3: Determine the Expected Frequencies
Here, you need to calculate the expected frequencies for each color. This will be given by the formula;
Expected Frequency, E= Total chocolates × Expected proportion
Now, using the formula, the expected frequencies for each of the colors is calculated as follows;
- Red: 100×0.30 = 30
- Blue: 100×0.20 = 20
- Green: 100×0.25 = 25
- Yellow: 100×0.25 = 25
Below is a table summarizing the observed (O) and expected (E) frequencies for each candy color. This table makes it easy to compare the actual observed data with the expected distribution before performing the Chi-Square Goodness of Fit calculations.
| Candy Color | Observed Frequency (O) | Expected Frequency (E) |
|---|---|---|
| Red | 25 | 30 |
| Blue | 18 | 20 |
| Green | 30 | 25 |
| Yellow | 27 | 25 |
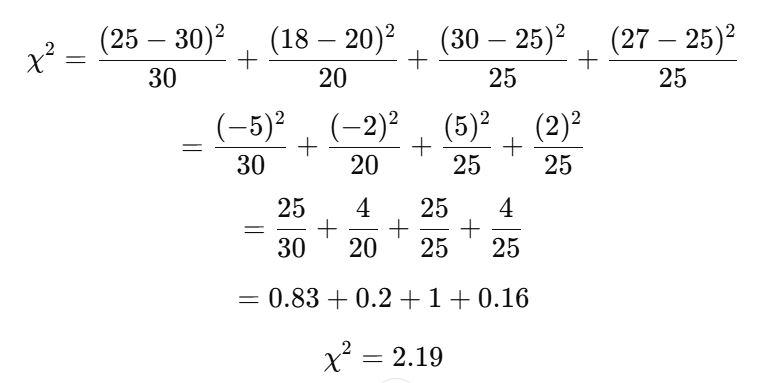
Step 4: Calculate the Chi-Square Statistic
To calculate the test statistic for the chi-square goodness of fit, we need to use the previously outlined formula:
Using the formula and substituting Observed and Expected values from the table, the test statistic can be computed as follows:
Step 5: Determine the Critical Value
After calculating the chi-square test statistic, the next step is to determine the critical value. The critical value helps us decide whether to reject the null hypothesis (H0).
To find the critical value, follow these steps:
- Determine the Degrees of Freedom (df)
- The degrees of freedom for the Chi-Square Goodness of Fit Test is calculated as: df=Number of categories−1
- In our example, we have 4 candy colors, so: df=4−1=3
- Choose a Significance Level (α)
- The significance level represents the probability of rejecting the null hypothesis when it is actually true.
- Common choices for α are 0.05 (5%) or 0.01 (1%). In most cases, α=0.05 is used.
- Use the Chi-Square Distribution Table
- The chi-square distribution table provides critical values for different degrees of freedom at specific significance levels.
- For df=3, α=0.05, the critical value is 7.815.
Step 6: Compare the Test Statistic with the Critical Value
Now that we have both the calculated chi-square test statistic (2.19) and the critical value (7.815) from the chi-square table, the next step is to compare them to decide whether to reject or fail to reject the null hypothesis.
Here’s how to make the correct decision for the hypotheses:
- If the calculated chi-square statistic (χ2) is greater than or equal to the critical value, we reject the null hypothesis (H0). This means the observed data significantly differs from the expected distribution.
- If the calculated chi-square statistic (χ2) is less than the critical value, we fail to reject the null hypothesis (H0). This suggests that the observed data does not significantly differ from the expected distribution.
Applying This to Our Example
- Calculated chi-square statistic: χ2=2.19
- Critical value (from table, df=3, α=0.05) = 7.815
- Since 2.19<7.815, we fail to reject the null hypothesis.
Step 7: Make a Conclusion
The final step in the Chi-Square Goodness of Fit Test is to interpret the results and draw a conclusion. Based on the comparison in Step 6, we fail to reject the null hypothesis (H0). Thus, the conclusion is written as follows:
Since the test statistic is smaller than the critical value, we do not have enough evidence to say that the observed distribution is significantly different from the expected distribution. This suggests that the company’s claim about the color distribution is reasonable based on our sample. In other words, the observed and expected distributions are similar enough that any differences could be due to random chance.
Conclusion
The Chi-Square Goodness of Fit Test is a useful statistical method for determining whether an observed distribution matches an expected one. It is commonly used in research, business analytics, and quality control to assess whether the distribution of a single categorical variable aligns with theoretical expectations.
Key takeaways:
- The test is used for one categorical variable to compare observed and expected frequencies.
- It requires assumptions such as independent observations and expected frequencies of at least 5 per category.
- The decision to reject or fail to reject the null hypothesis is based on comparing the chi-square statistic to a critical value from the chi-square distribution table.
However, if you’re working with two categorical variables and want to test for an association between them, consider using the Chi-Square Test of Independence.
Need Help with Chi-Square Goodness of Fit?
Performing the Chi-Square Goodness of Fit Test can be challenging, especially when dealing with large datasets, complex expected distributions, or software limitations. If you’re struggling with calculations, interpreting results, or using statistical tools like SPSS, R, or Python, our expert statisticians are here to help!
Don’t let statistical challenges slow you down! Hire a Statistician Today and get professional assistance with your chi-square analysis.