

In hypothesis testing, a critical value is a threshold or cutoff point that defines the boundary of the rejection region…
Introduction to IBM SPSS Statistics: The SPSS Environment
Is this your first time encountering IBM SPSS Statistics? If you’re a beginner looking for the best SPSS tutorial on how to get started with SPSS, then you’re in the right place. In this article, we discuss the 3 main windows in SPSS environment, how to navigate through them, and how to use them when performing statistical analysis using SPSS. The article also presents the common mistakes and errors you’re likely to encounter when using these SPSS Windows and how to avoid them.
The SPSS Environment: An Overview
There are 3 main windows in SPSS. These include:
- Data Editor: This consists of the variable view and data view. The variable views allow users to create variables while the data view allows users to view & insert data into each of the defined variables.
- Output Viewer: This window shows the results when the analysis is performed. It also includes the commands used by SPSS to perform specific statistical tests.
- Syntax Editor: This window allows users to write commands if they prefer using commands over the drop-down menu provided by SPSS.
Navigating Through the 3 Main SPSS Windows
1. Data Editor
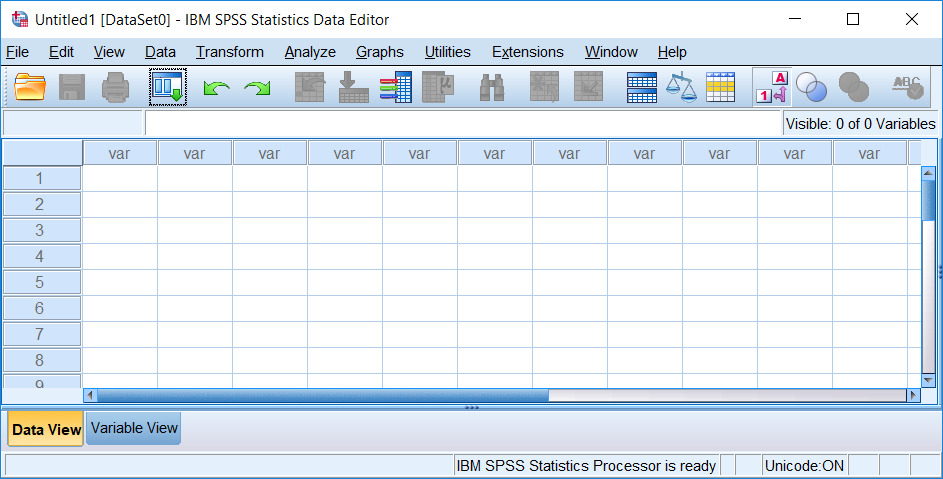
The Data Editor Window can be said to be the heart of any data analysis task. As identified above, it consists of the Variable view & Data view. These are discussed below:
The Variable View: Defining Your Data
The Variable View was designed to allow users to define the variables and attributes in the dataset. Specifically, the variable view has several columns, with the main ones being; Name, Type, Values, Label, Missing, and Measure. The roles of each of the columns are discussed below:
- Name – This allows users to define variable names. Note that the variable name should not contain a space but can contain an underscore.
- Type – The type column allows users to specify the data type of the defined variables. So, you can indicate whether the variable is numeric, string, date, or dollar.
- Values – The values column is only useful if the defined variable is categorical. For instance, if you have a variable Gender, with categories, Male and Female, you can use the numeric type and assign 1 to Males and 2 to Females in the Values column.
- Label – This column allows users to insert a descriptive statement for the defined variables. For instance, if you created a variable named, Age, you can include, as the label, the sentence, “How old are you.” These descriptive statements help readers to understand the variables used in the analysis.
- Missing – This column allows users to code for missing values in the data. For instance, you can decide to represent all missing values with a value say 999. This column allows you to insert any missing value in the data with 999 simultaneously.
- Measure – This column in the variable view helps users to indicate the correct data type of each of the variables. Specifically, you can indicate whether the variable is Scale (interval/continuous variables), nominal (Categorical variables without ordering), or Ordinal (categorical variables with obvious ordering).
Therefore, understanding the Variable View is very critical for accurate and reliable data analysis results.
The Data View: Entering and Editing Your Data
The Data Views is also an important section of the Data Editor that allows users to input and manipulate data. It’s similar to Excel/Spreadsheet. This means, that with the data view, you can directly insert data manually into cells, copy and paste data from other sources, or import data from various formats such as TXT, CSV, Excel, etc. Additionally, it provides an interface for users to edit data by making corrections, updating values, and managing missing data efficiently.
2. Output Viewer: Unveiling the Results
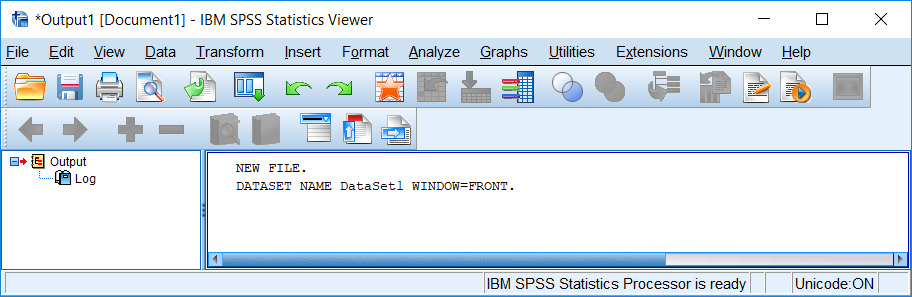
Once you run any statistical test using SPSS, the outputs are displayed in the Output Window. The SPSS outputs may include, table and charts, and other statistics-related tables. So, you need to learn how to interpret these outputs by learning statistical concepts such as p-values, confidence intervals, etc.
The SPSS output window also allows you to customize and format the output to suit your needs. For instance, by double-clicking on a table, you get additional formatting to enhance clarity. Additionally, you can export the generated SPSS output to various formats, say PDF, Word, Excel, etc.
3. Syntax Editor
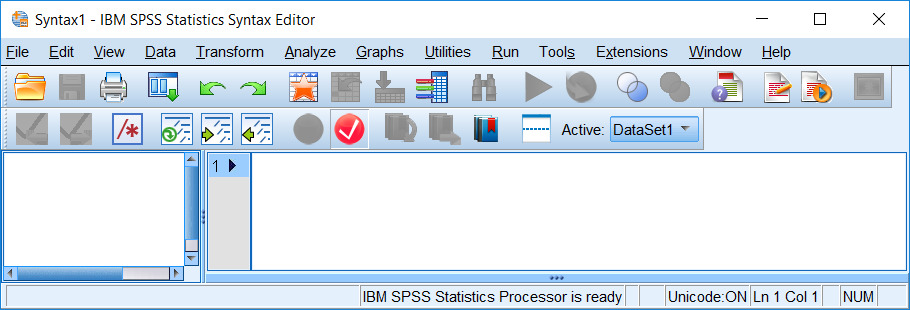
Using SPSS Syntax can streamline complex tasks and ensure reproducibility. SPSS syntax allows users to automate repetitive tasks, document their analysis steps, and easily modify data analysis procedures. This is particularly useful for large and complex projects.
Below are some of the simple commands to demonstrate how to use SPSS syntax.
- Descriptive Statistics – To perform descriptive statistics using the SPSS Syntax window, copy and paste the following command:
DESCRIPTIVES VARIABLES=age income /STATISTICS=MEAN STDDEV MIN MAX.This command calculates the mean, standard deviation, minimum, and maximum for the variables “age” and “income.” - Frequency Table: To understand the percentage distribution of categorical variables, you can use the following command:
FREQUENCIES VARIABLES=gender /ORDER=ANALYSIS.This command produces a frequency table for the variable “gender.”
Common Errors/Mistakes When Using SPSS and How to Avoid Them
Many SPSS beginners are prone to making various mistakes/errors when exploring the SPSS Environment. Below are some of the mistakes/errors you’re likely to encounter and how to avoid them:
Data Entry Mistakes
- Incorrect Variable Types: Ensure you select the appropriate variable type in Variable View. For instance, numeric data should not be entered as string variables.
- Missing Data Handling: Properly code and document missing data. Use SPSS’s missing value codes and avoid leaving blank cells, which can lead to misinterpretation.
- Consistent Data Entry: Maintain consistency in data entry. For example, if using a Likert scale, ensure all entries follow the same format and coding scheme.
Syntax Errors
- Typographical Errors: Double-check your syntax commands for typos or missing elements. Even a small mistake can cause the syntax to fail.
- Incorrect Command Usage: Make sure you are using the correct commands for your intended analysis. Consult the SPSS documentation or help resources if unsure.
Analytical Mistakes
- Overlooking Assumptions: Each statistical test has underlying assumptions (e.g., normality, homoscedasticity). Always check these assumptions before proceeding with the analysis.
- Misinterpreting Results: Understand the output and what it represents. Avoid making conclusions without a proper understanding of statistical significance and effect sizes.
Final Take Away
- SPSS has 3 main windows; Data Editor, Output Viewer, and Syntax Window
- Data Editor is central to data analysis, with Variable View for defining variables and Data View for data input and editing.
- Output Viewer: Displays analysis results, including tables and charts, and allows customization and exporting of outputs.
- Syntax Editor: Enables command-based analysis for automation and reproducibility, useful for complex projects.
Convinced of the Power of SPSS, But Need a Helping Hand?
While this guide equips you with the basics of navigating the SPSS environment, data analysis can get complex. Don’t be discouraged! Our SPSS data analysis services can empower you to take your research to the next level.
Here’s how we can help:
- Data Cleaning and Preparation: We ensure your data is accurate and ready for analysis, saving you valuable time.
- Statistical Expertise: Our team of statisticians can guide you in choosing the right tests and interpreting the results with confidence.
- Advanced Analysis: Need to go beyond basic procedures? We can handle complex analyses to uncover deeper insights from your data.
- Clear Communication: We translate statistical jargon into clear and actionable findings, tailored to your specific needs.
Ready to unlock the full potential of your data? Contact us today for a free consultation!