

How to Report and Interpret a One-Sample T-test SPSS Results
Are you done performing a one-sample t-test in SPSS and struggling with how to interpret the tables and write the results in APA style? This article will teach you how to interpret and report a one-sample t-test SPSS results and how to present these results in APA format.
How to report a One-Sample T-Test SPSS Outputs: Step-by-Step Guide
- STEP 1: Report the Descriptive Statistics of SPSS output
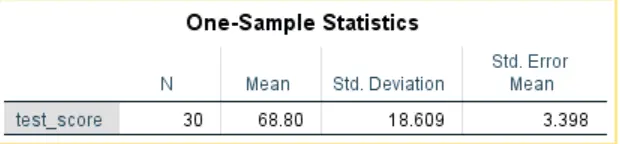
The first table produced when you run a one-sample t-test in SPSS is the descriptive statistics table (Table 1). Thus, you need to interpret this table before interpreting the t-test SPSS results. The table provides the sample size (N), the average score (M), the standard deviation (SD), and the Standard error of the mean (SE). When reporting the descriptive statistics table, we are only interested in the sample size, the average, and the standard deviation. Here is how you should report the table.
The descriptives statistics results showed that the average test score was 68.80 (N = 30, M = 68.80, SD = 18.61).
- Step 2: Report the One-Sample T-Test SPSS output
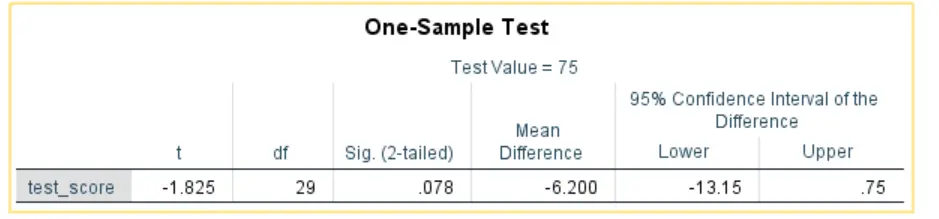
The next table after you’ve conducted a one-sample t-test in SPSS is the one-sample t-test SPSS output (Table 2). You need to pay attention to your alternative hypotheses when interpreting these results, . Most SPSS versions will only give you a p-value for the two-sided t-test. However, there are 3 cases you might encounter when interpreting a one-sample t-test results. These cases are:
- Case 1: Upper-sided t-test
- Case 2: Lower-sided t-test
- Case 3: Two-sided t-test
The interpretation of the t-test results based on the above cases is discussed below.
CASE 1: Upper-sided test
Recall. In our previous tutorial on performing a one-sample t-test using SPSS, we tested the hypotheses:
H0: μ = 75
Versus
H1: μ > 75
As you can see, the above test is a one-sided t-test (upper-sided). So, the p-value is obtained as 1-(0.07/2)
= 0.961
Interpretation
In our example, the p value (0.961) is greater than the 0.05 level of significance. So, we should fail to reject the null hypothesis. This implies that there was no sufficient evidence to support the claim that the new study method is effective in increasing students’ scores beyond the historical average of 75.
CASE 2: Lower-Sided Test
Now, suppose that we aimed to test the hypotheses:
H0: μ = 75
Versus
H1: μ < 75
Now, the test is still a one-sided t-test (lower-sided test). Here, the p-value would be different and should be obtained as follows;
P value = 0.078/2
= 0.039
In this case, the interpretation would be different and would be as follows:
In our example, the p value (0.039) is less than the 0.05 level of significance. So, we should reject the null hypothesis. This implies that there was sufficient evidence to conclude that the new study method reduced the students’ scores below the historical average of 75.
CASE 3: Two-Sided test
Recall: We said that most SPSS versions will give you two-sided p-values. In our tutorials, we use SPSS version 26.
Now, suppose you are testing the hypotheses:
H0: μ = 75
H1: μ ≠ 75
Then, this would be a two-sided t-test and the interpretation would be;
In our example, the p value (0.078) is greater than the 0.05 level of significance. So, we should Fail to reject the null hypothesis. This implies that there was no sufficient evidence to conclude that the average score was significantly different from the population average score of 75.
Reporting One-Sample T-Test SPSS Results in APA Style
If you’re working on your dissertation data analysis results and looking for how to report one-sample t-test results in APA format, then read below;
A One-sample t-test was conducted to determine whether the new study method was effective in increasing students’ scores beyond the historical average of 75. The average biology test score in the exam was 68.80 (N = 30, M = 68.80, SD = 18.61), which was below the historical average of 75. In fact, the one-sample t-test revealed that the average score was not significantly greater than the historical average, t (29) = -1.83, p = 0.961. Therefore, we can conclude that the new method was not effective in increasing the students score beyond the historical average of 75.
You can visit our SPSS tutorials page for more tutorials on how to run various statistical tests in SPSS and how to interpret and report the SPSS outputs.